The canvas
Your whole analysis on one board
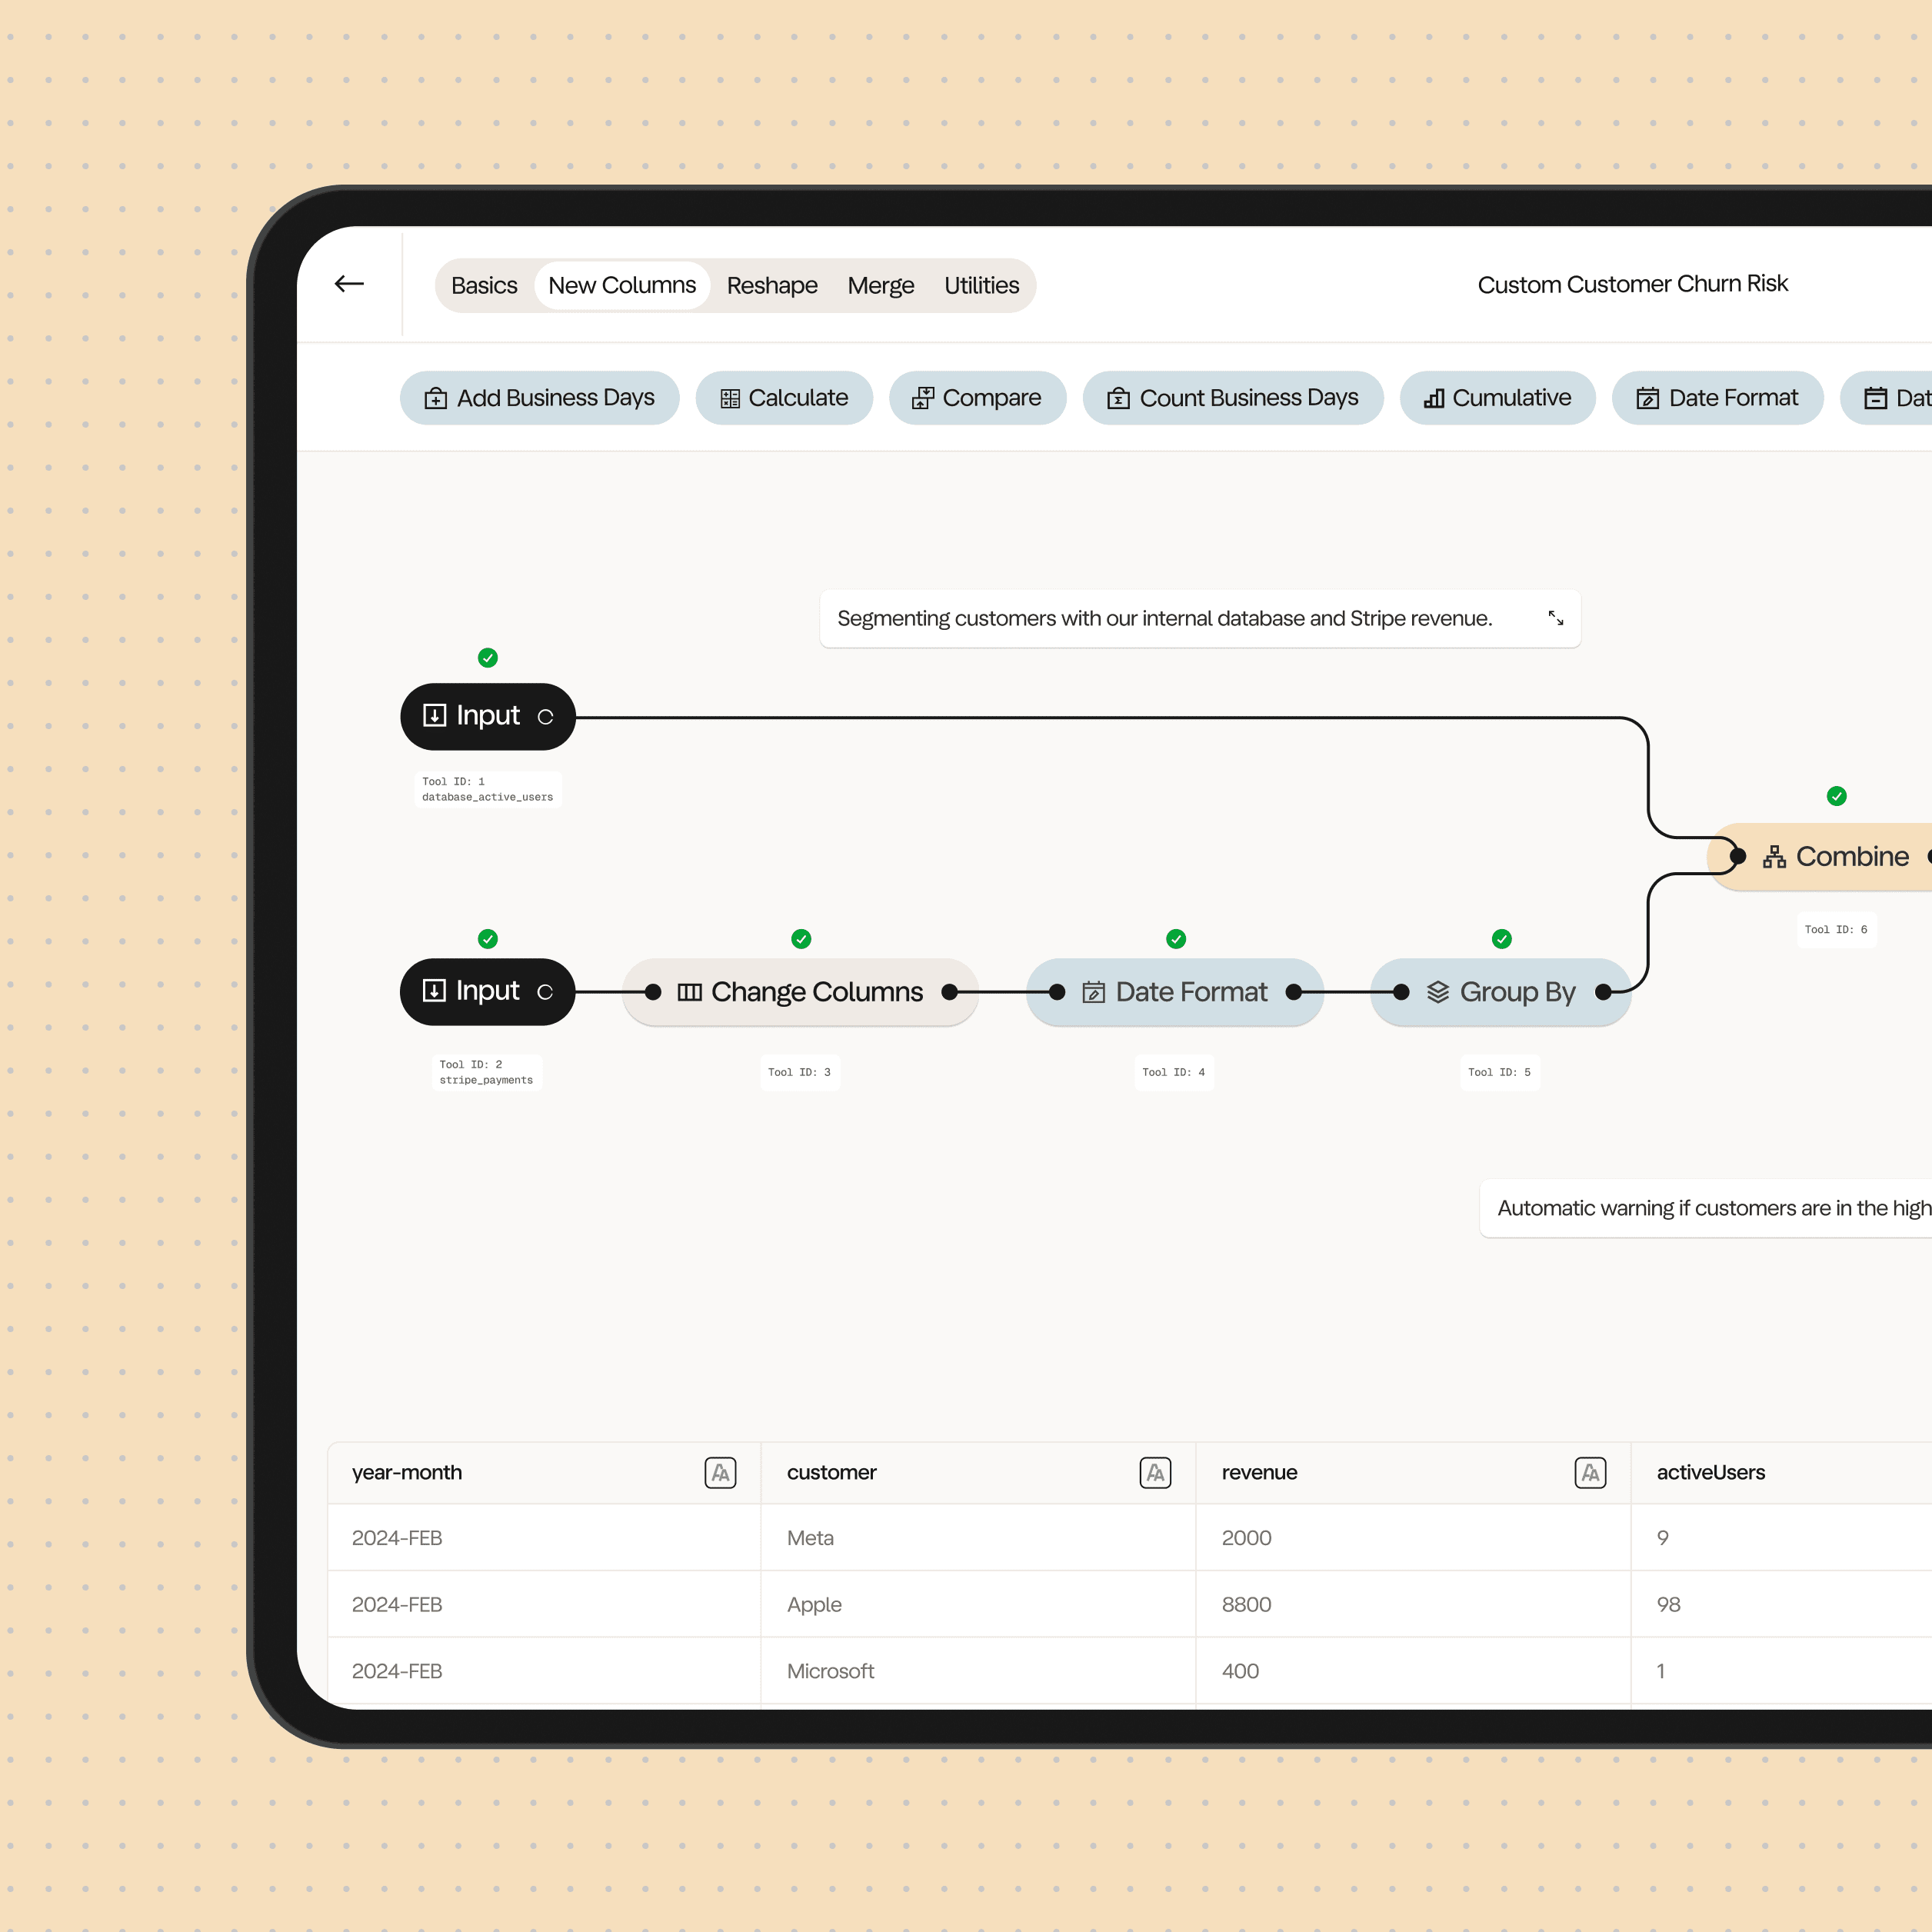
Each tool is a step - pull in data, reshape it, combine sources, and add your custom logic. Follow the flow left to right and the pipeline reads like a sentence.
canvas
Go from raw data to analysis with full control, understanding every step. The Canvas is a visual data analysis tool that allows you to build your own analysis pipeline.
“Less makes me feel like a programmer without being one.”
The canvas
Each tool is a step - pull in data, reshape it, combine sources, and add your custom logic. Follow the flow left to right and the pipeline reads like a sentence.
Tools
Use tools to transform your data sequentially. Change Columns renames and drops fields, Date Format normalizes dates, and Group By rolls everything up.
Configuration
Open any tool to configure it - pick columns, set aggregations, rename fields. Change a setting and the step reruns, so downstream results stay in sync.
Live preview
The results grid mirrors whichever tool you select, with live row and column counts. Edit a step and the data recalculates instantly, so you always know exactly what each tool produced.
Documentation
Every tool carries an annotation describing what it does, and the Comment tool lets you document across steps. All of it saved as a JSON file under the hood.
The canvas
Each tool is a step - pull in data, reshape it, combine sources, and add your custom logic. Follow the flow left to right and the pipeline reads like a sentence.
Tools
Use tools to transform your data sequentially. Change Columns renames and drops fields, Date Format normalizes dates, and Group By rolls everything up.
Configuration
Open any tool to configure it - pick columns, set aggregations, rename fields. Change a setting and the step reruns, so downstream results stay in sync.
Live preview
The results grid mirrors whichever tool you select, with live row and column counts. Edit a step and the data recalculates instantly, so you always know exactly what each tool produced.
Documentation
Every tool carries an annotation describing what it does, and the Comment tool lets you document across steps. All of it saved as a JSON file under the hood.
Features
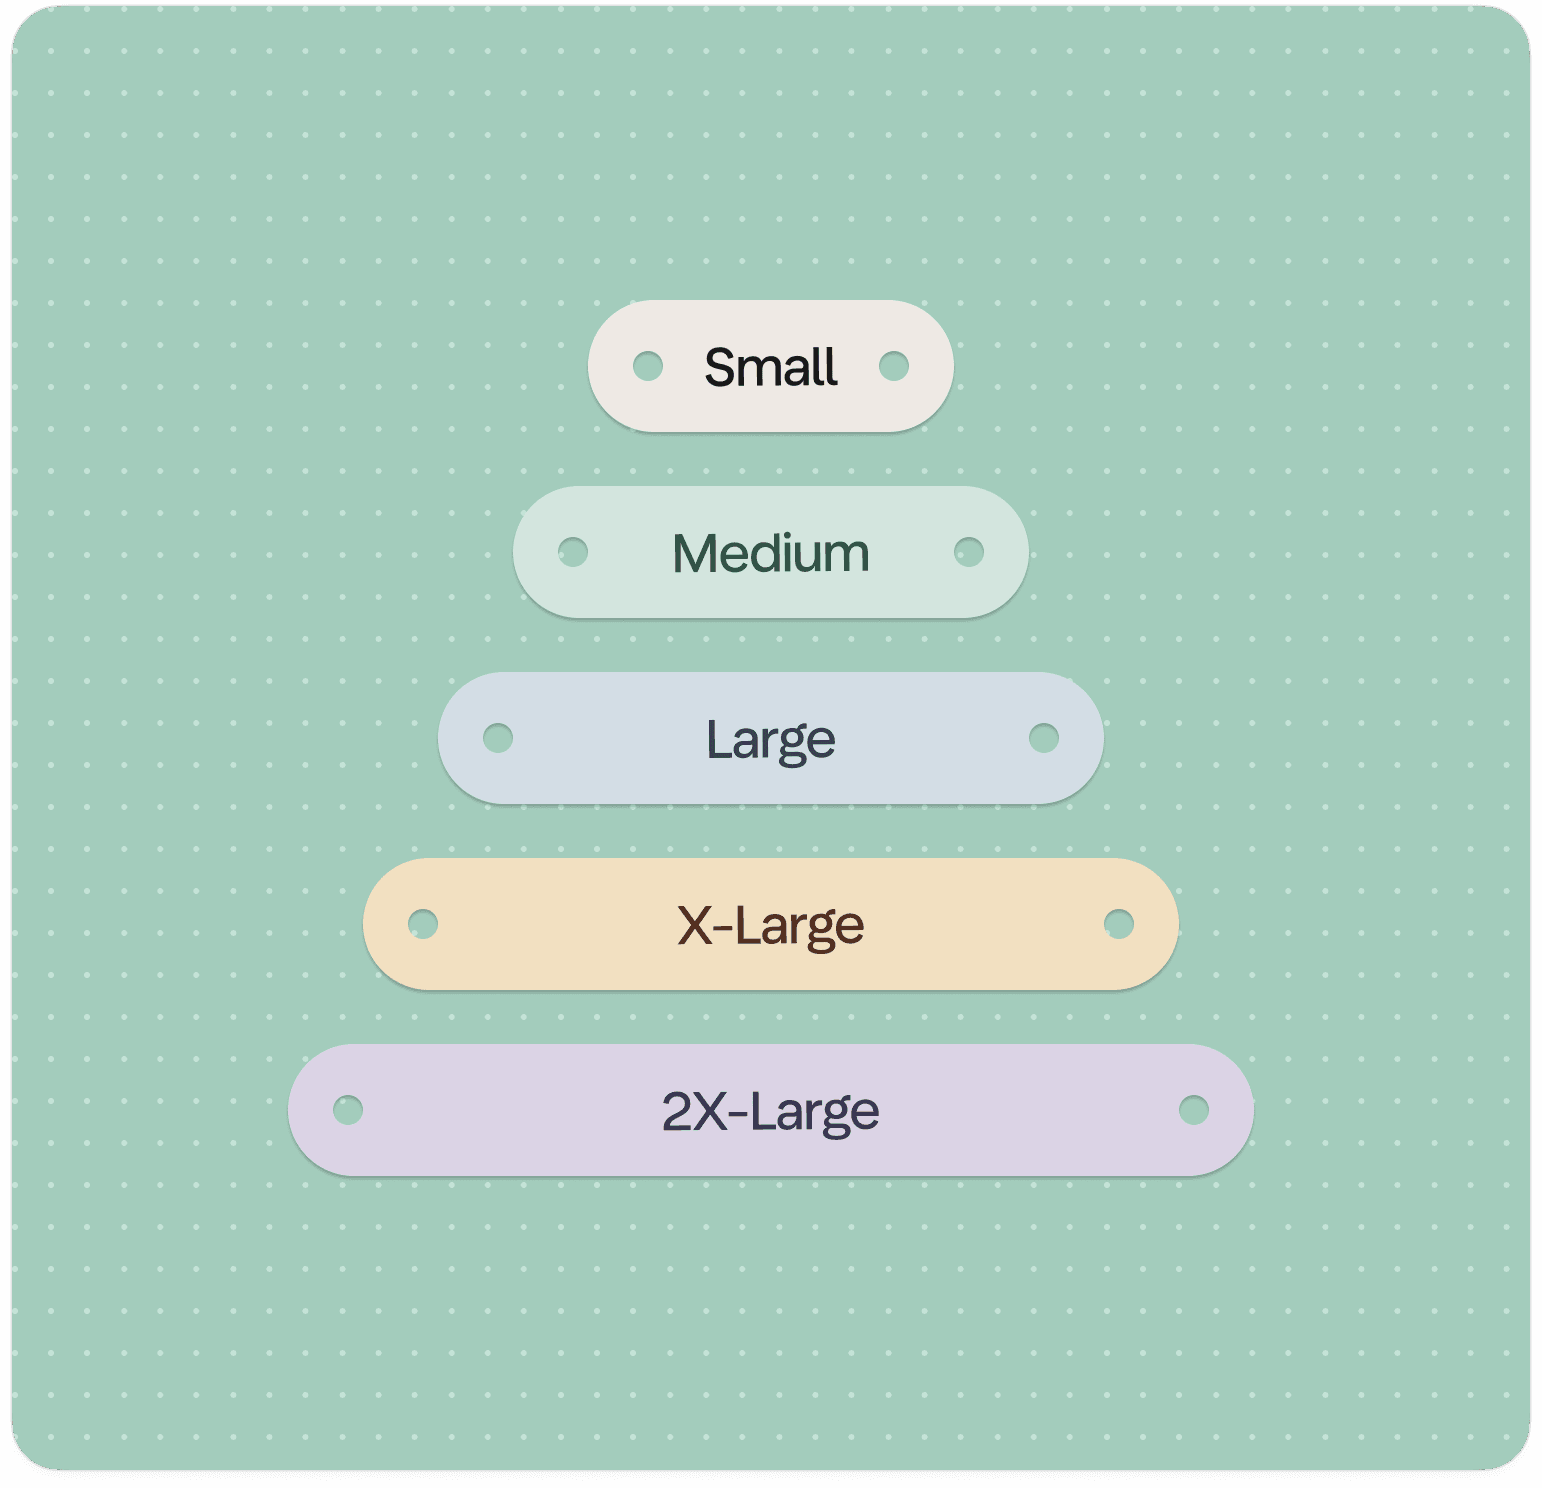
Pick your instance size and get more power the moment you need it.
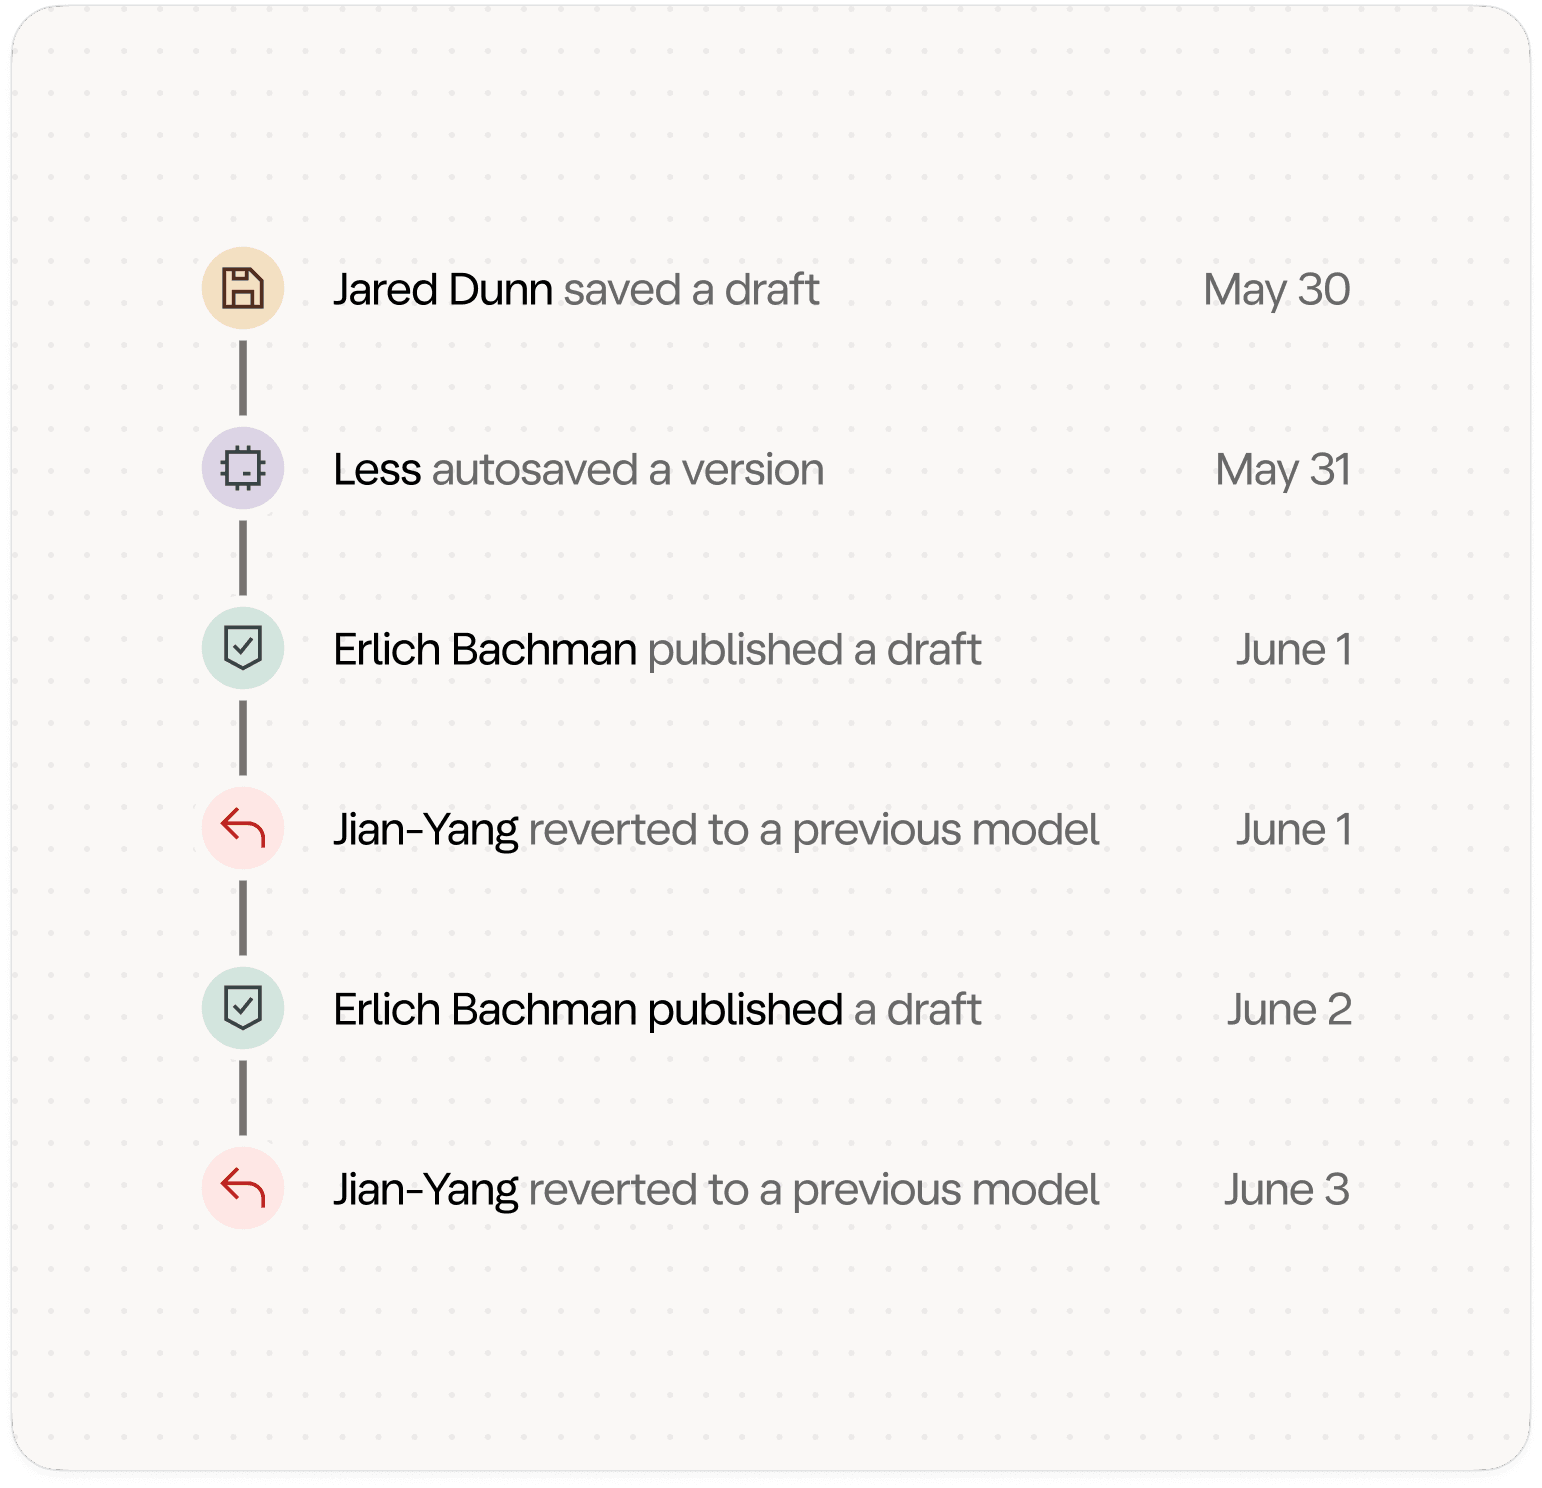
See a full audit log with deltas and visual diffs between any two versions.
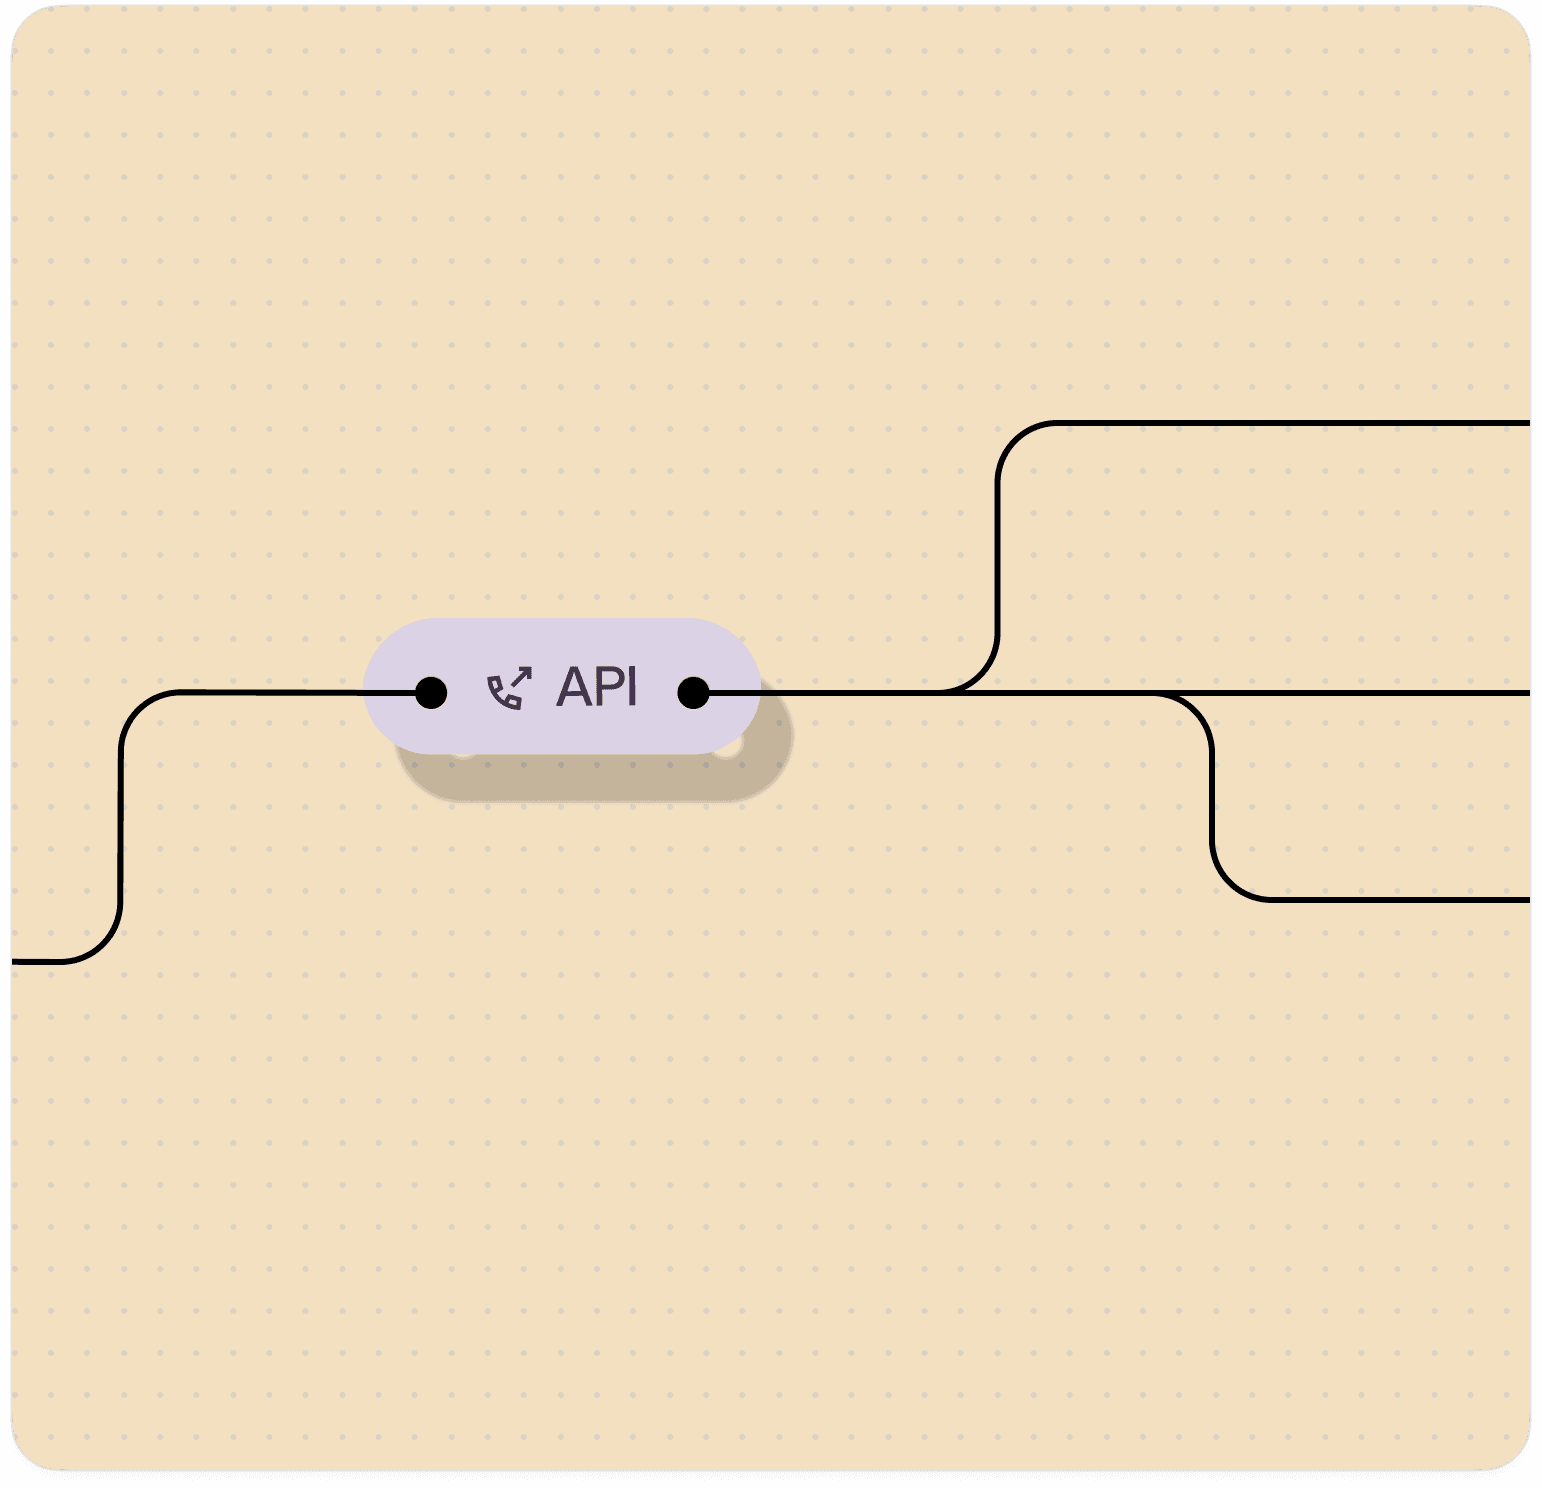
Call any API mid-model to pull in, enrich, or send out data on the fly.
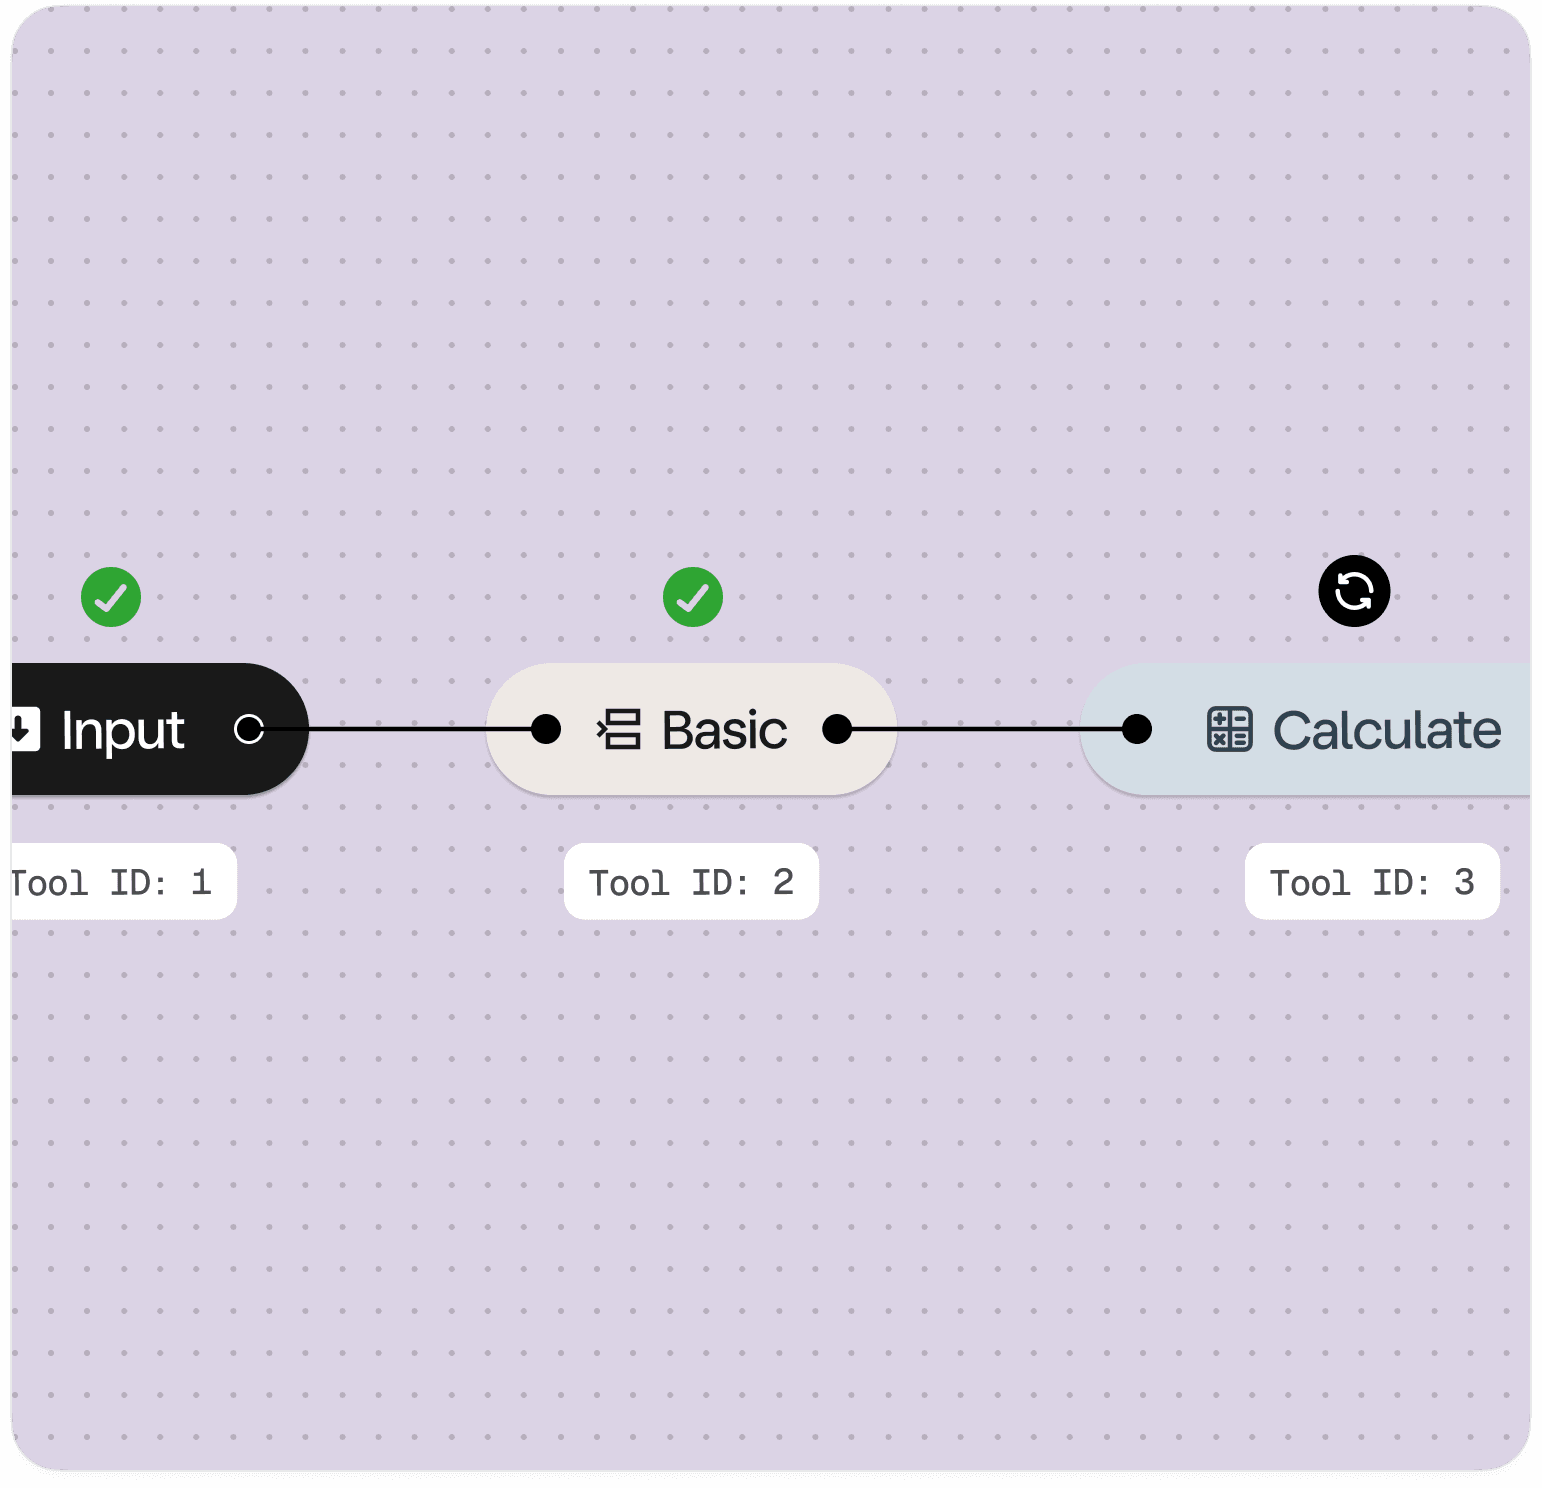
We automatically cache results so your model stays snappy and fast.

Keep changes in draft while your published version stays live in production.
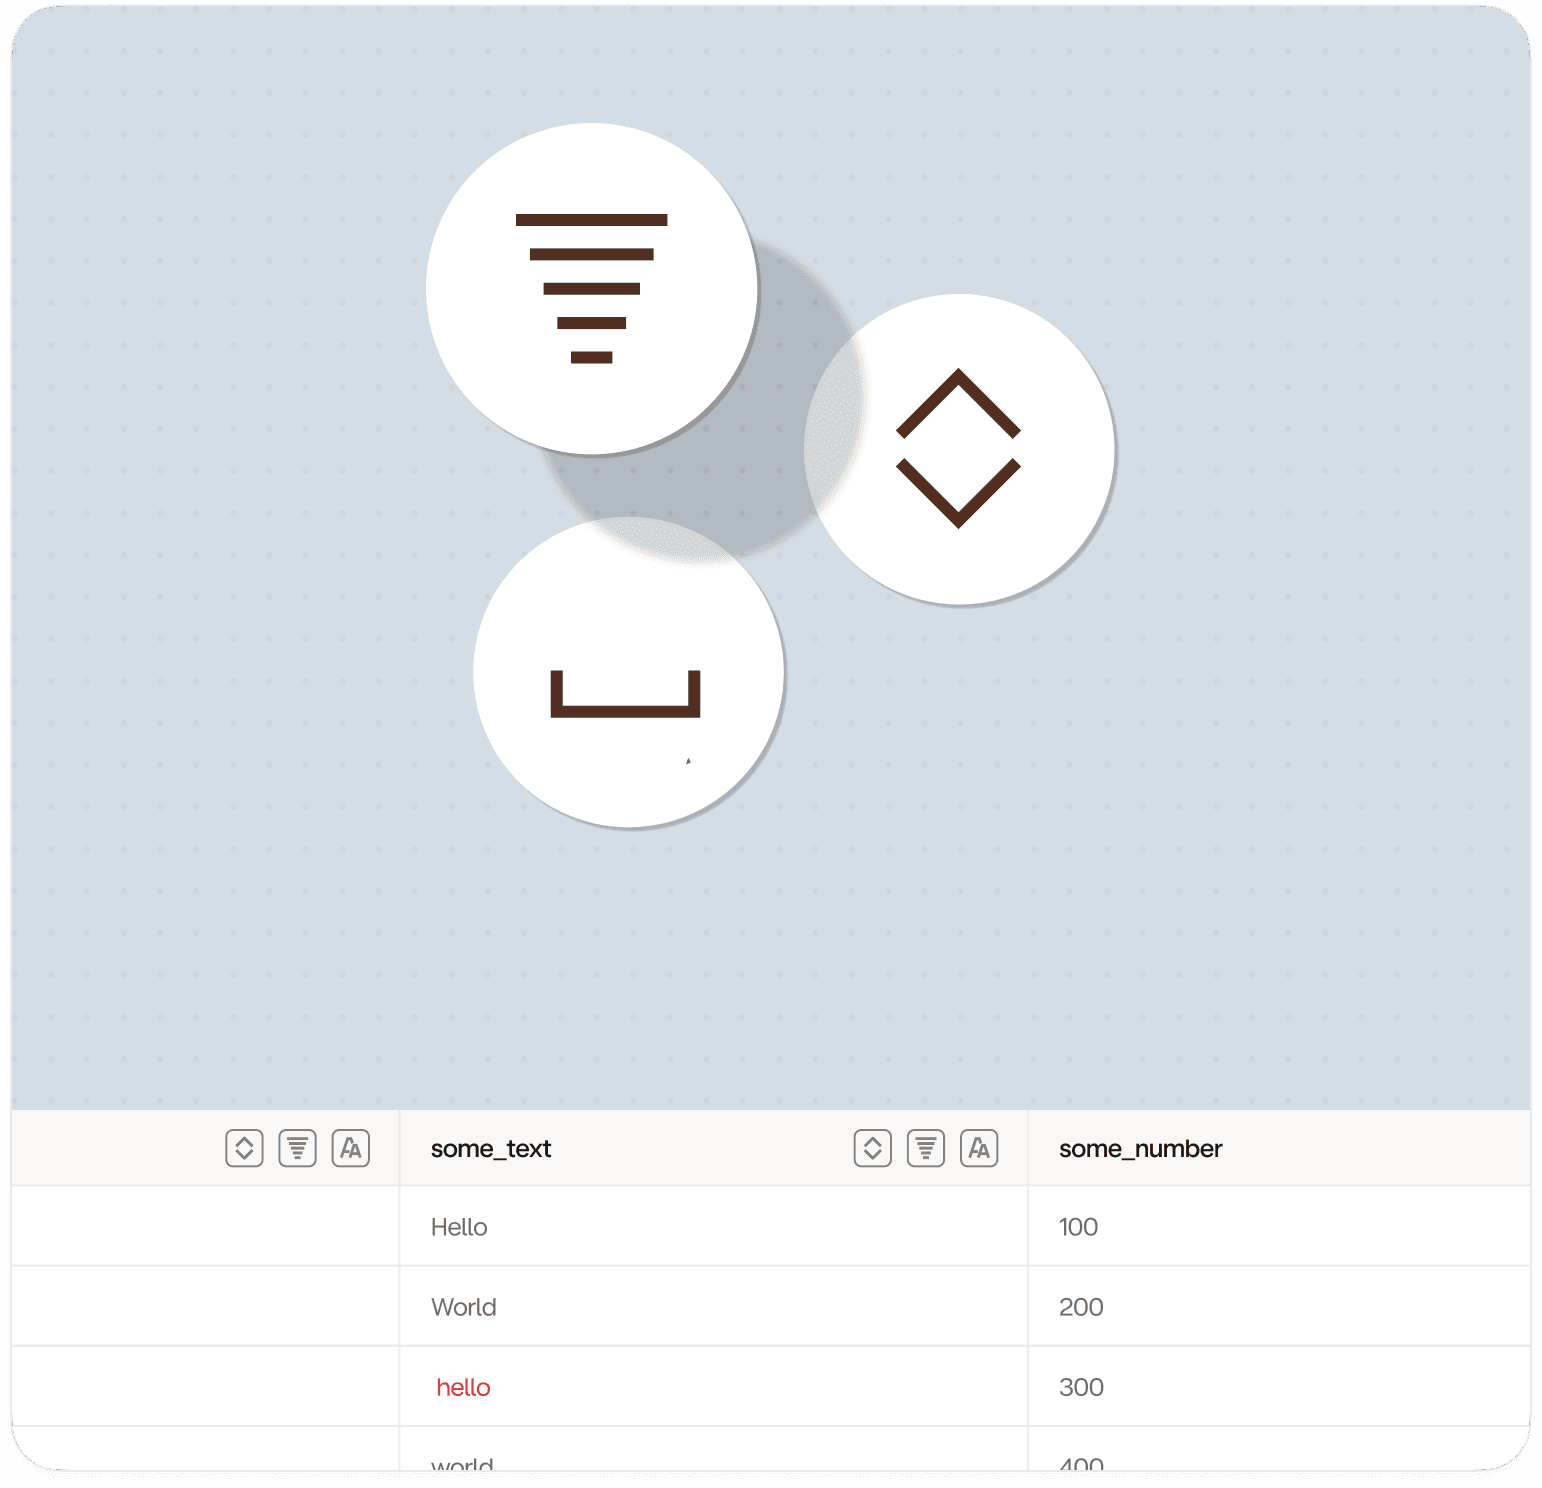
Use the data grid to filter, sort, and spot trailing whitespace before you build a single tool.
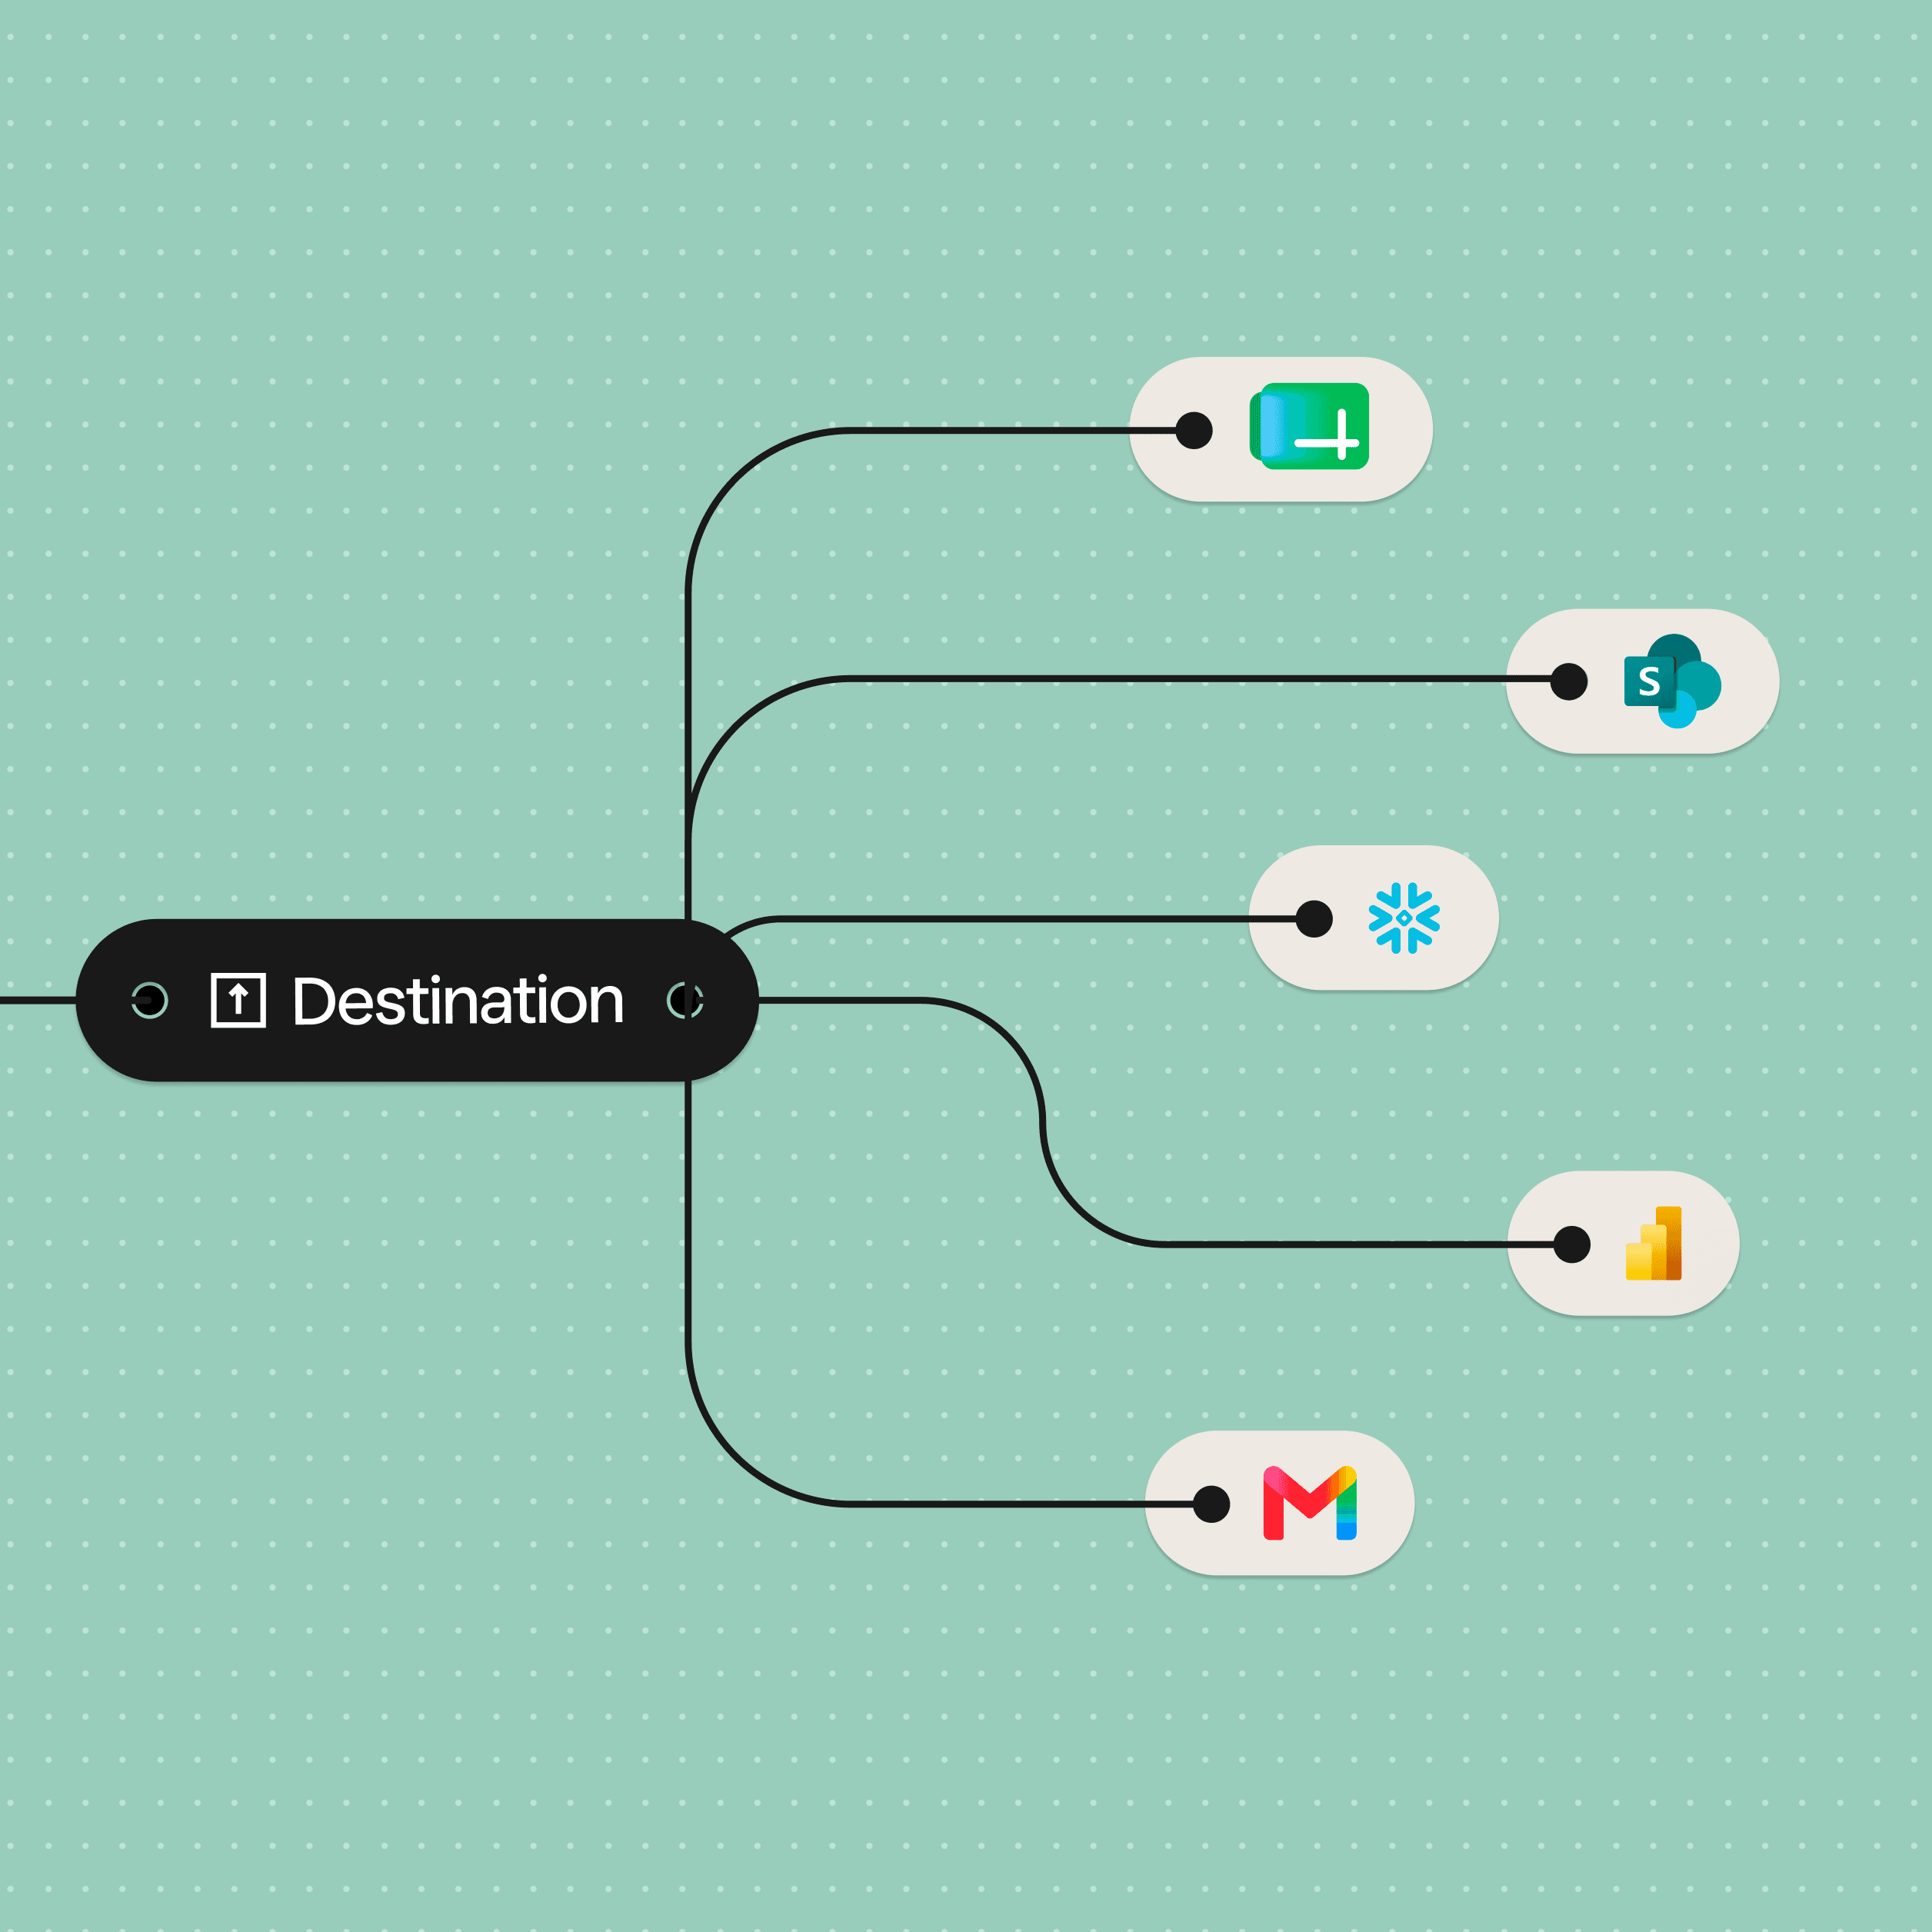
Use our Destinations to send data to your favorite tools.
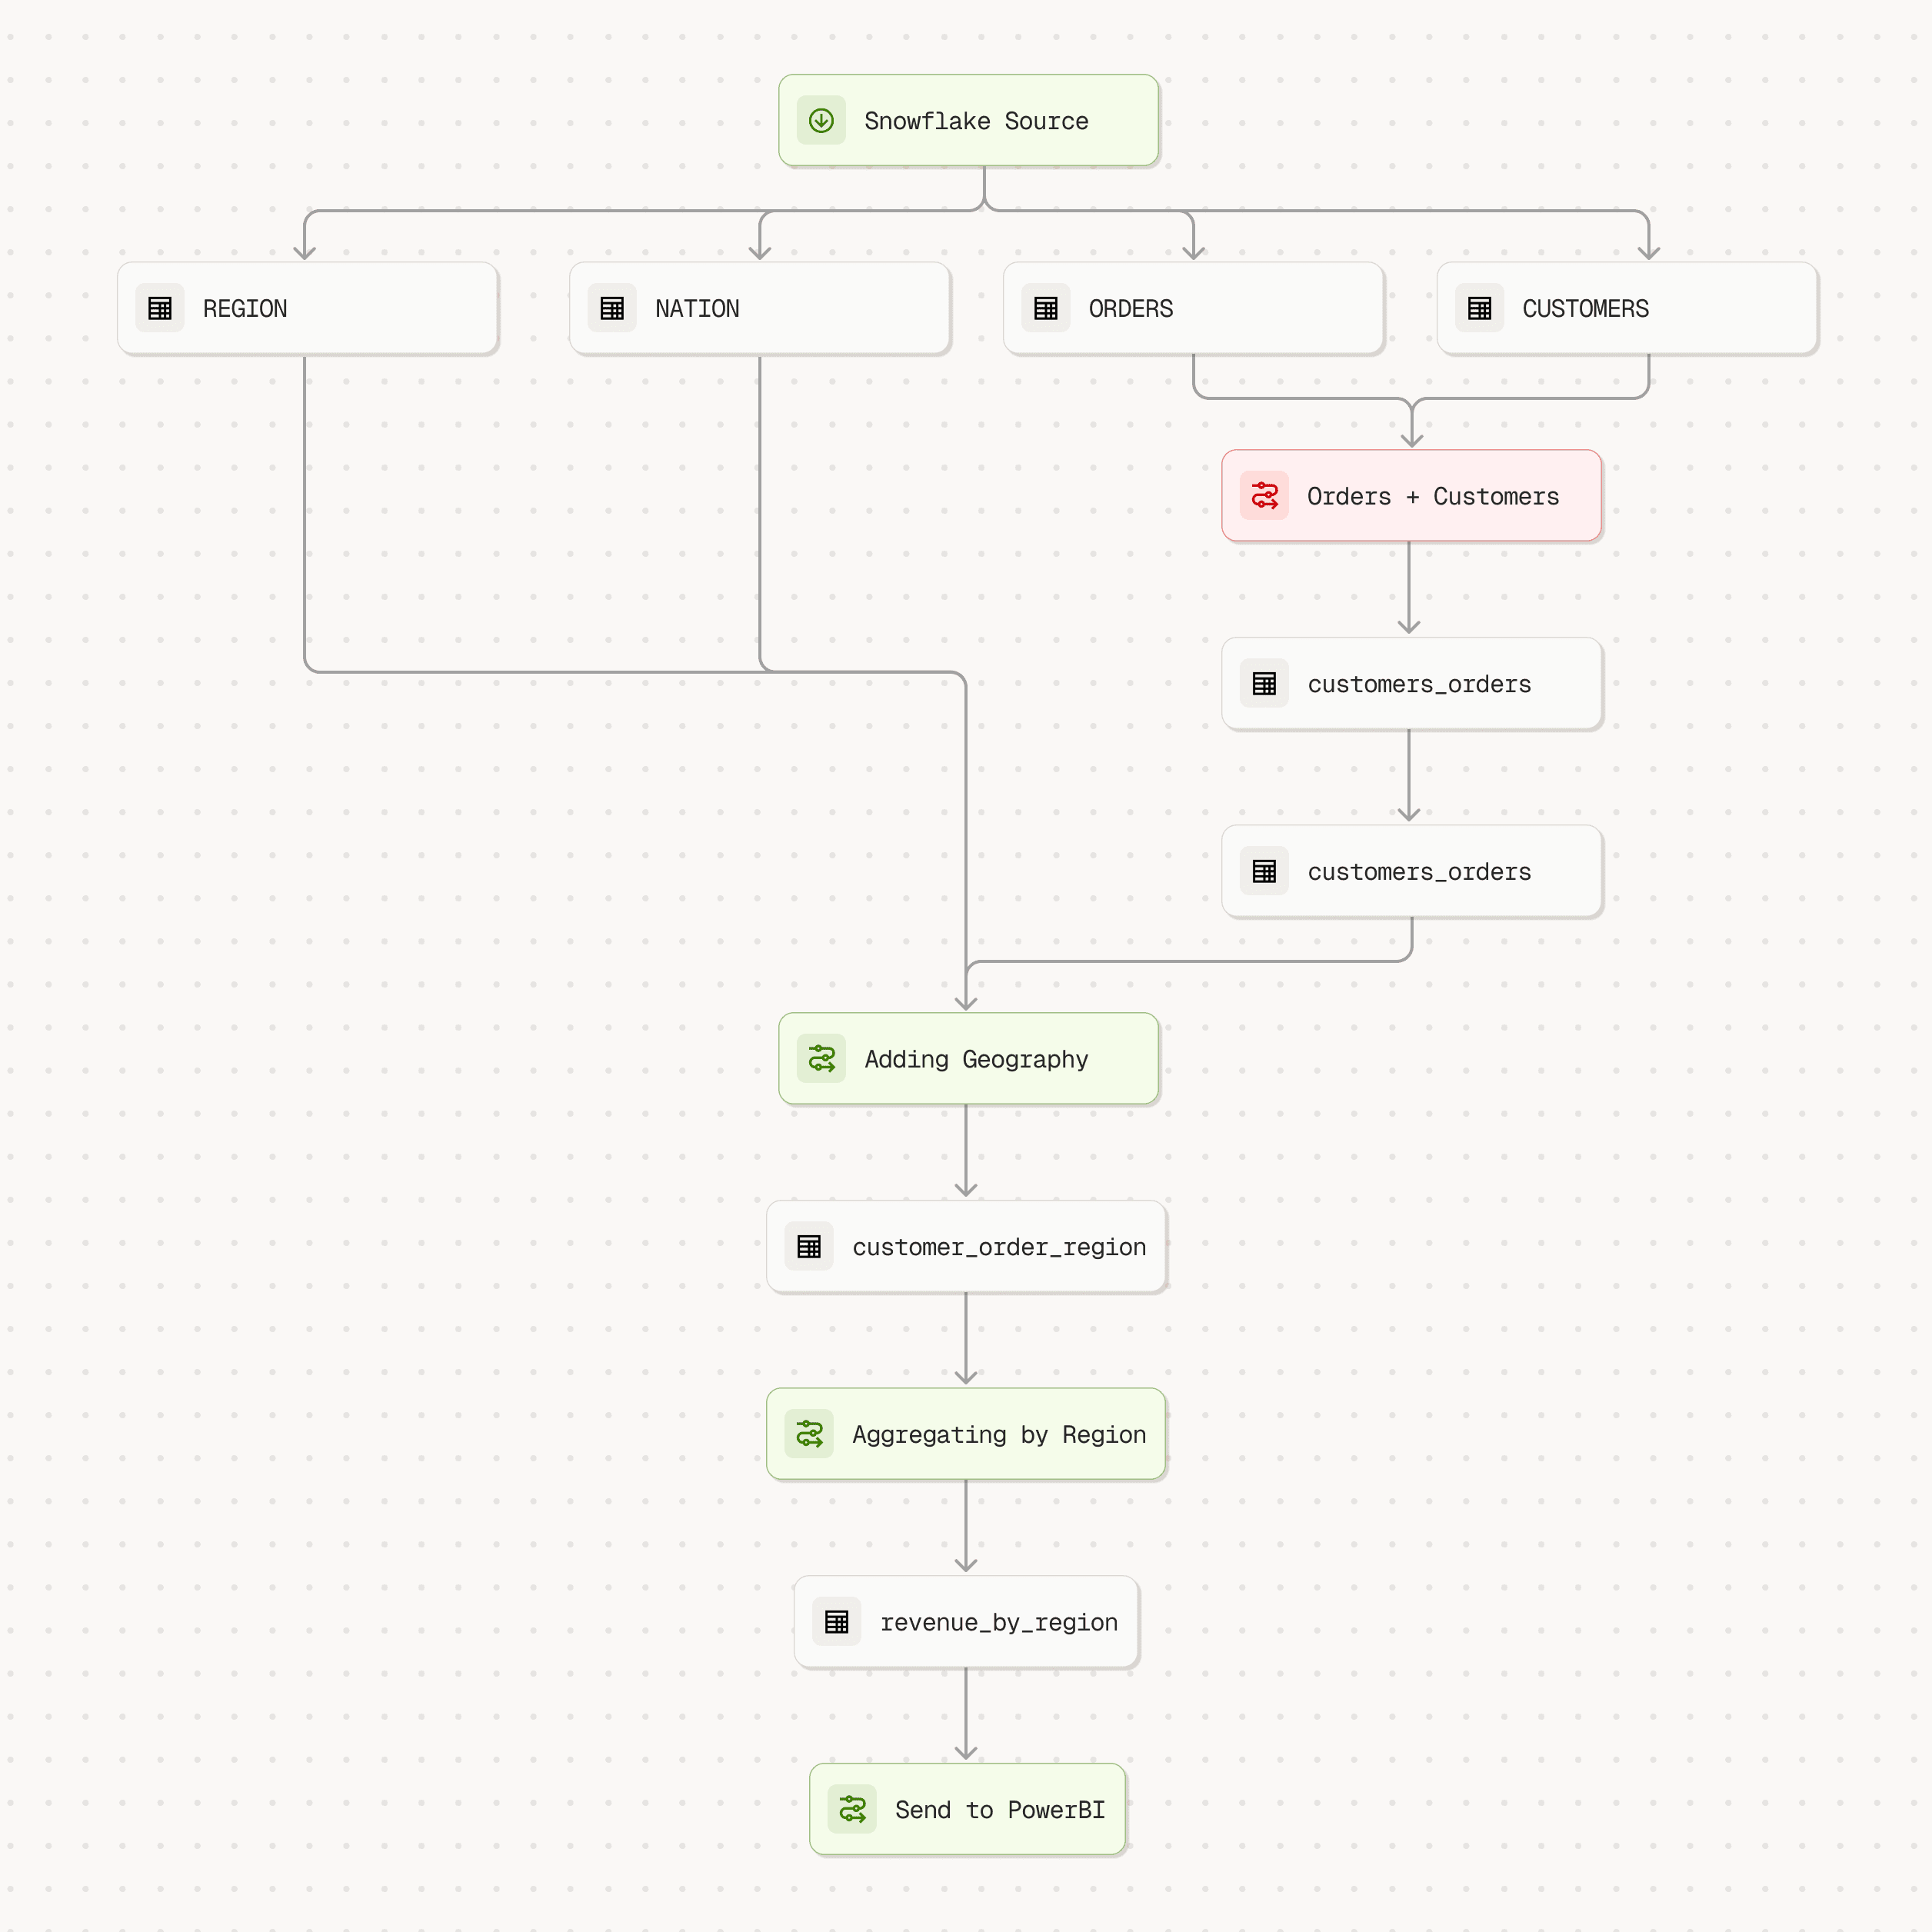
Lineage gives you visibility of all your projects dependencies.