lineage
Zoom out
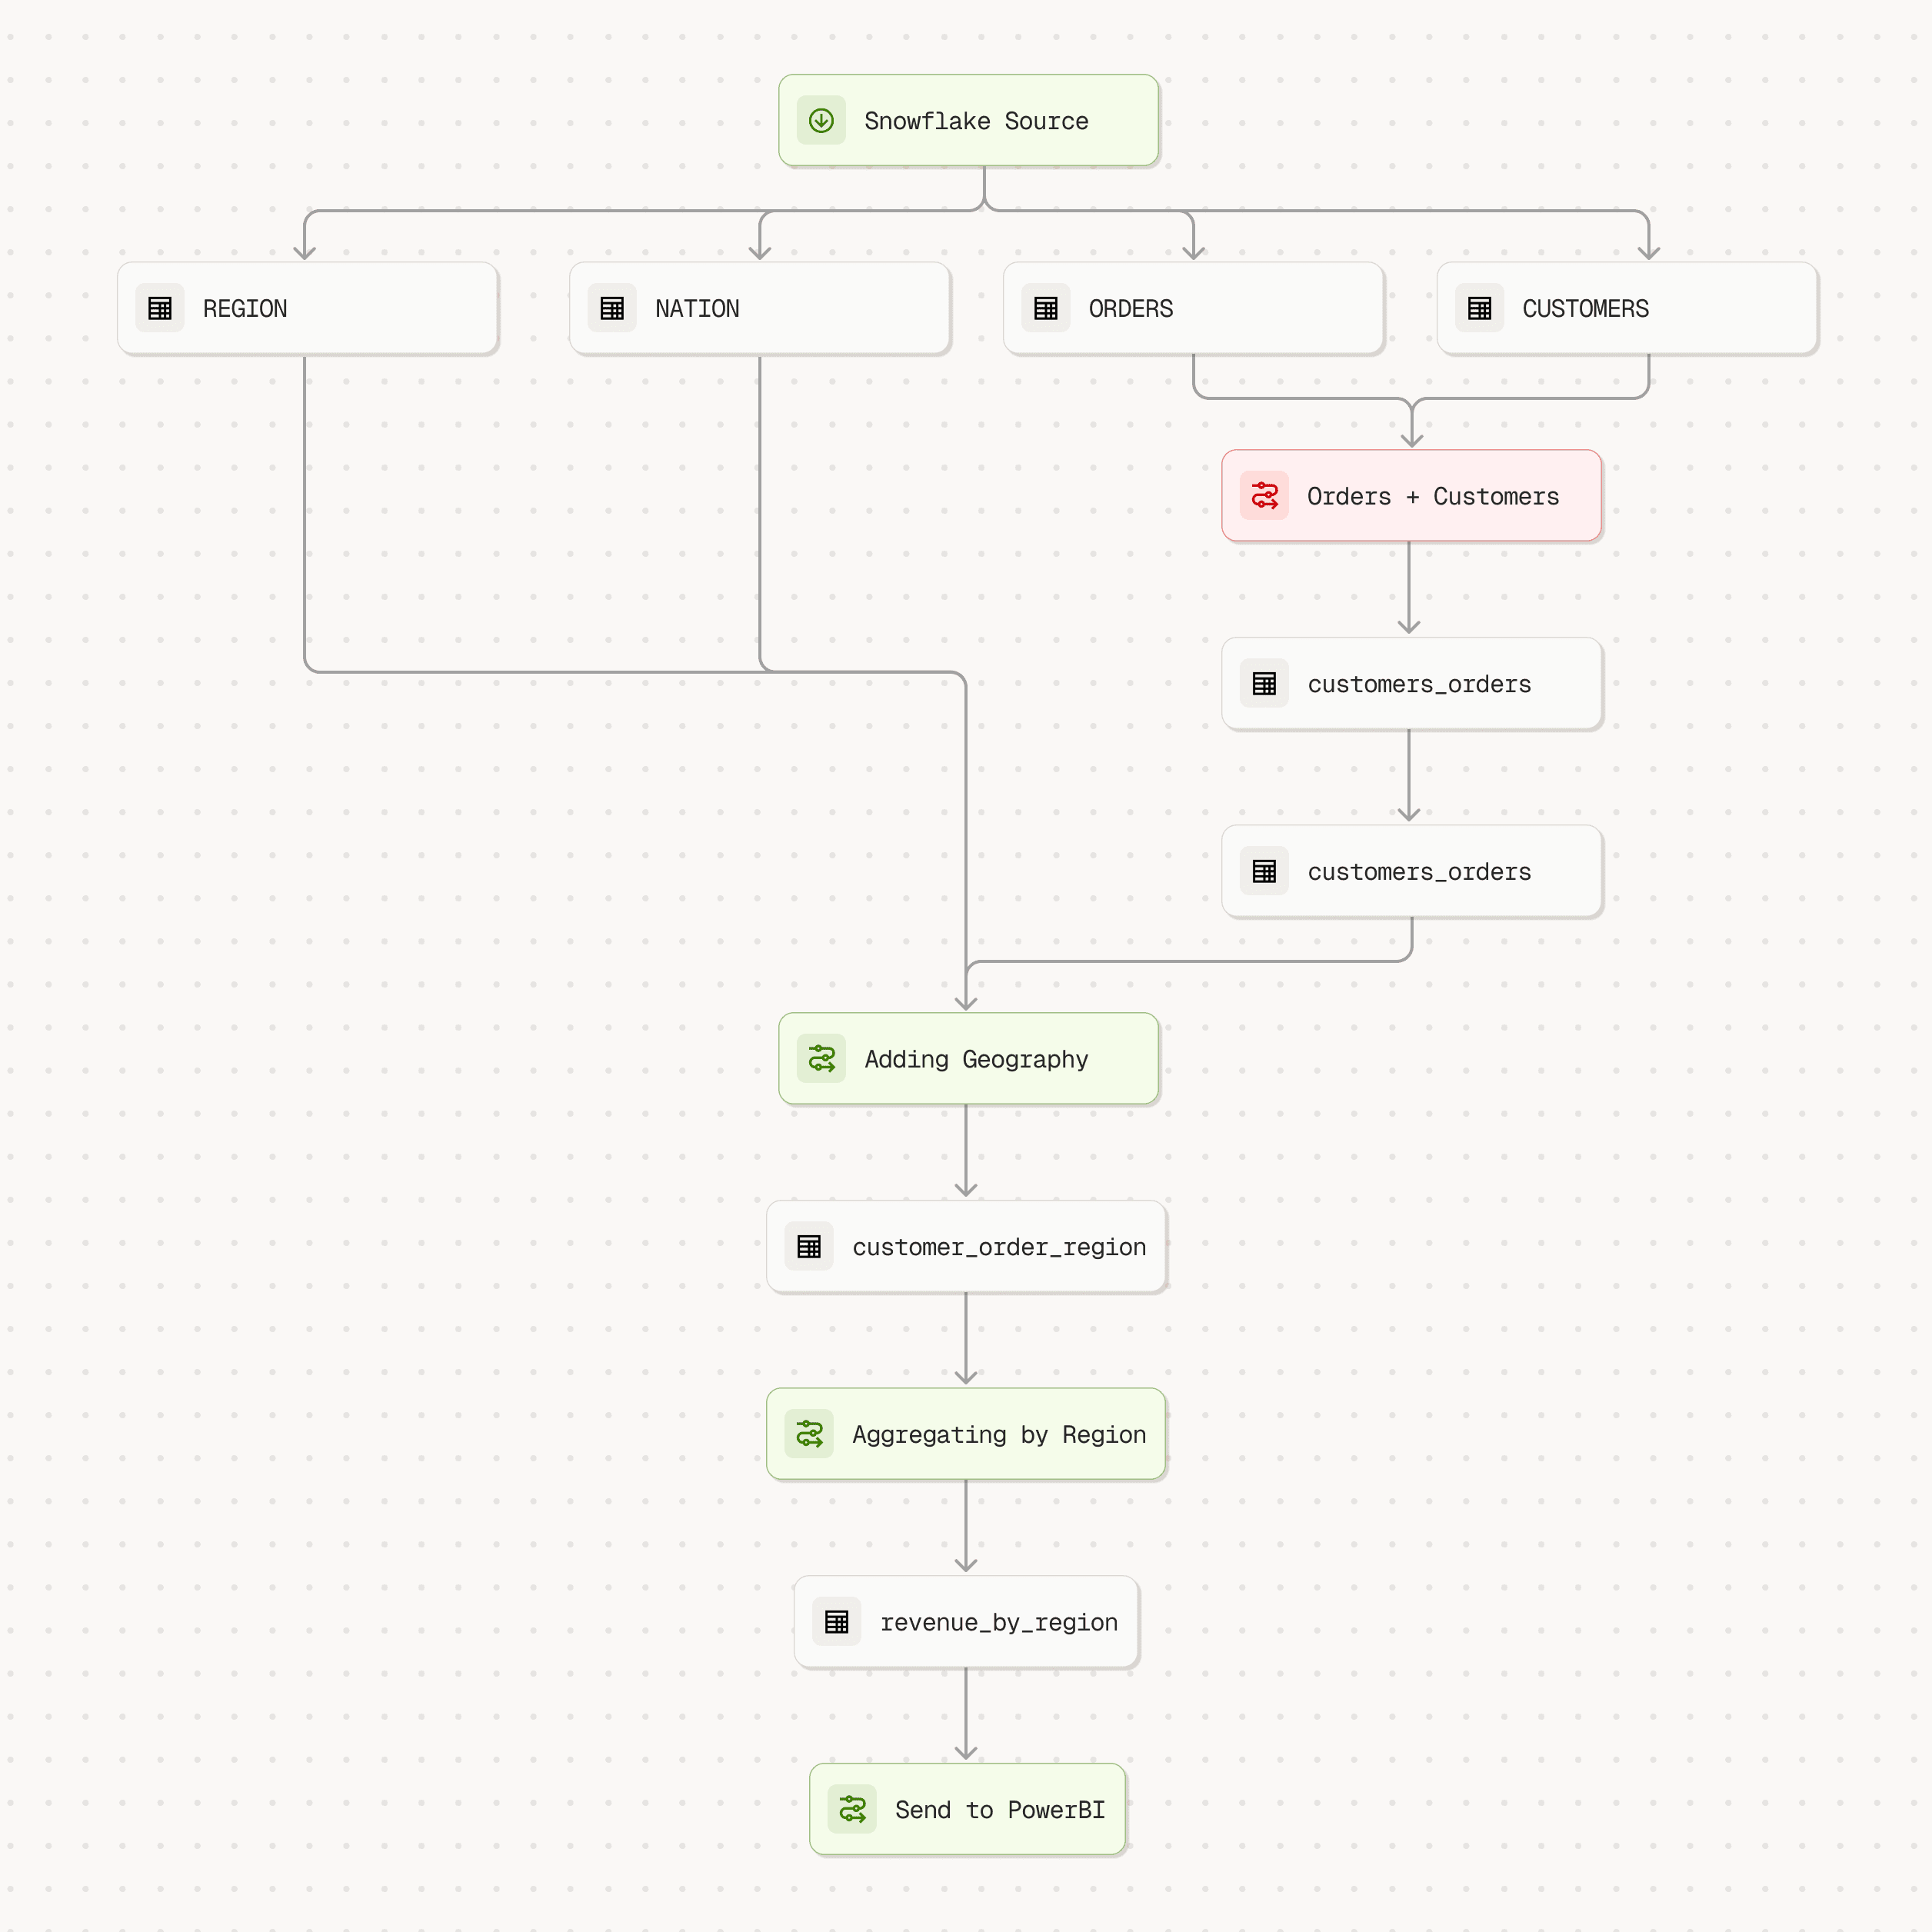
It can be difficult to see the big picture when you got hundreds of sources, tables and models. Lineage helps you zoom out so you can zoom in on the parts that matter.
“Less has been a pivotal solution for us.”
Lineage
Which models use this table? What breaks if I delete this column?
Lineage answers that - trace every column from source to dashboard.
Hover any asset for the full picture - run history, triggers, and every column in the schema.
Or just skip to our Assistant to trace anything for you.
When do we aggregate our data?
What exchange rate are we using for US orders?
I can't find our B2B segment — are we removing those?
Snowflake Database
ORDERS
CUSTOMERS
Orders + Customers
customer_orders
Add Region & Nation
Last run
Jun 24, 2026, 11:57 · 11 days ago
Trigger
Manual
Published version
Yes
cleaned_orders
Last write
Jun 24, 2026, 11:57 · 11 days ago
Rows
1,500,000
Columns
8
- order_idInteger
- order_dateText
- order_statusText
- total_priceDecimal
- market_segmentText
- customer_nationText
- customer_regionText
- eur_to_usdDecimal
Revenue Column Lineage Investigation
How is my revenue column created in the
Revenue By Region table?
1 step completed ›
The revenue column in revenueByRegion is created by a Group By tool that sums the totalPrice column grouped by region.
The pipeline flows:
- step1 reads ORDERS and combines it with customer data.
- step2 enriches that with nation and region data, then multiplies totalPrice by an exchange rate of 7.45 — so the totalPrice that feeds into step3 is currency-converted.
- step3 (your Revenue by Region model) groups by region and sums that converted totalPrice into revenue.
Analyze data
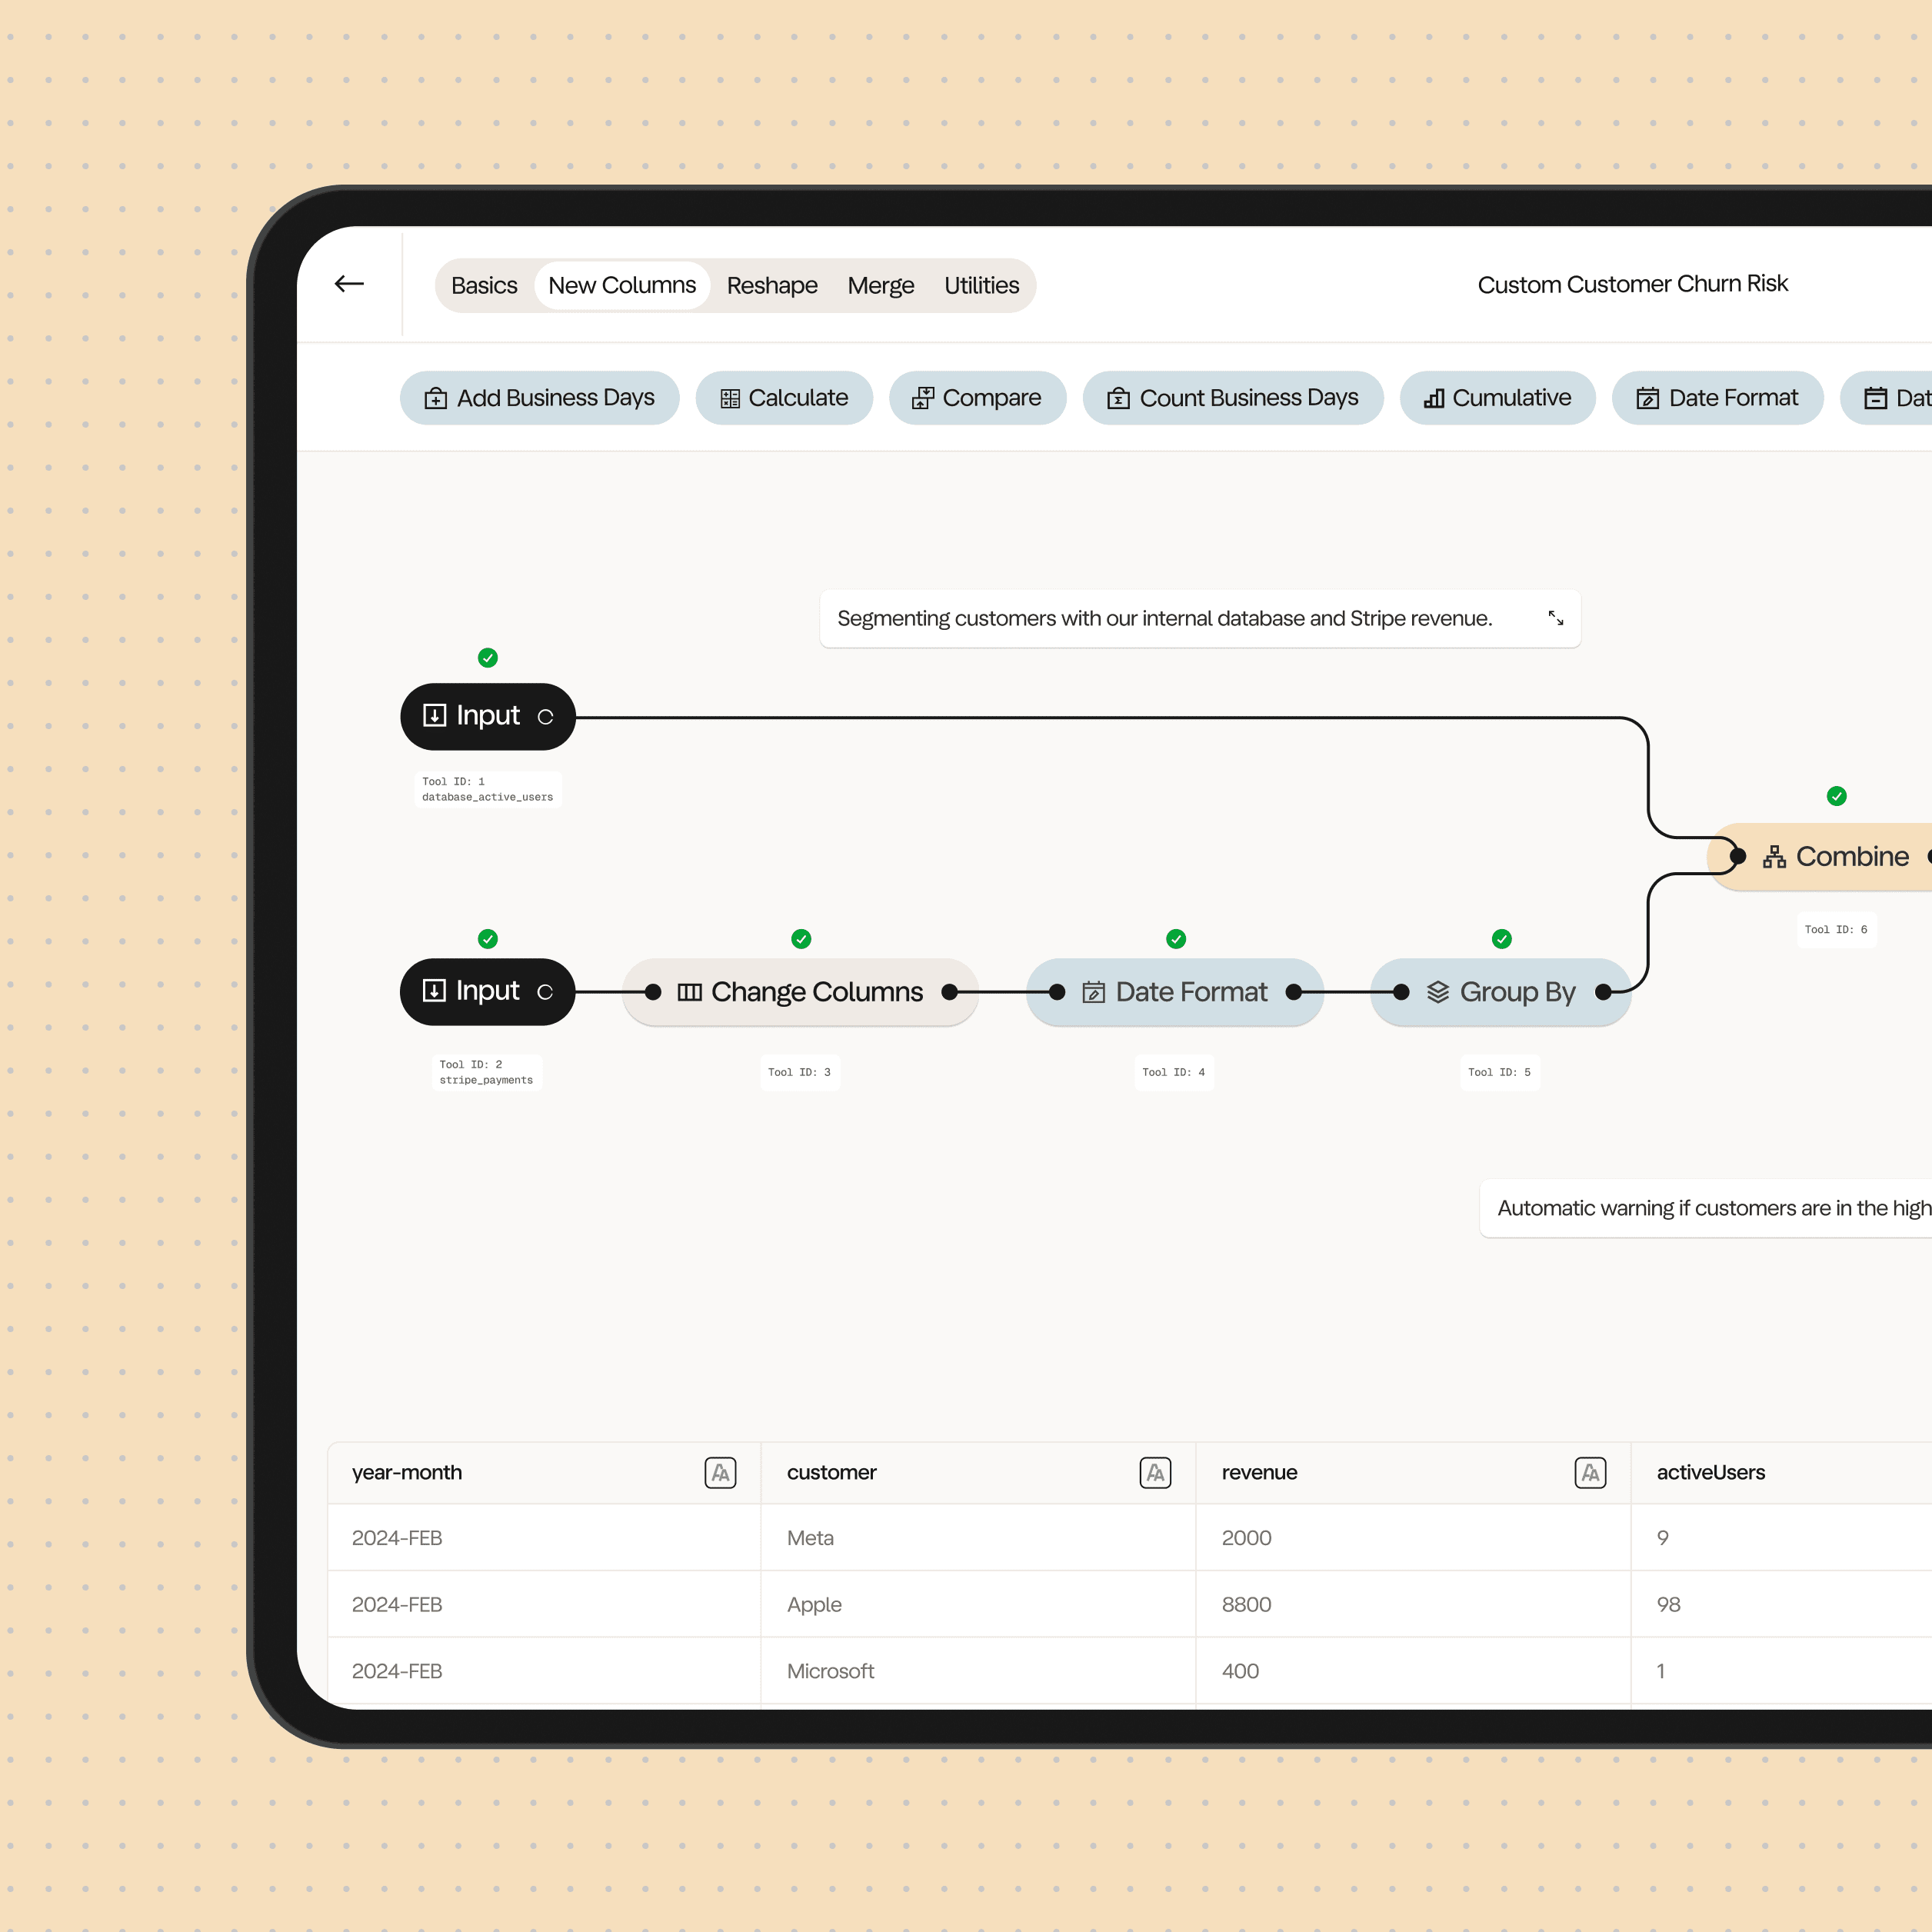
Use the Canvas to get your data in the right shape.
Get data
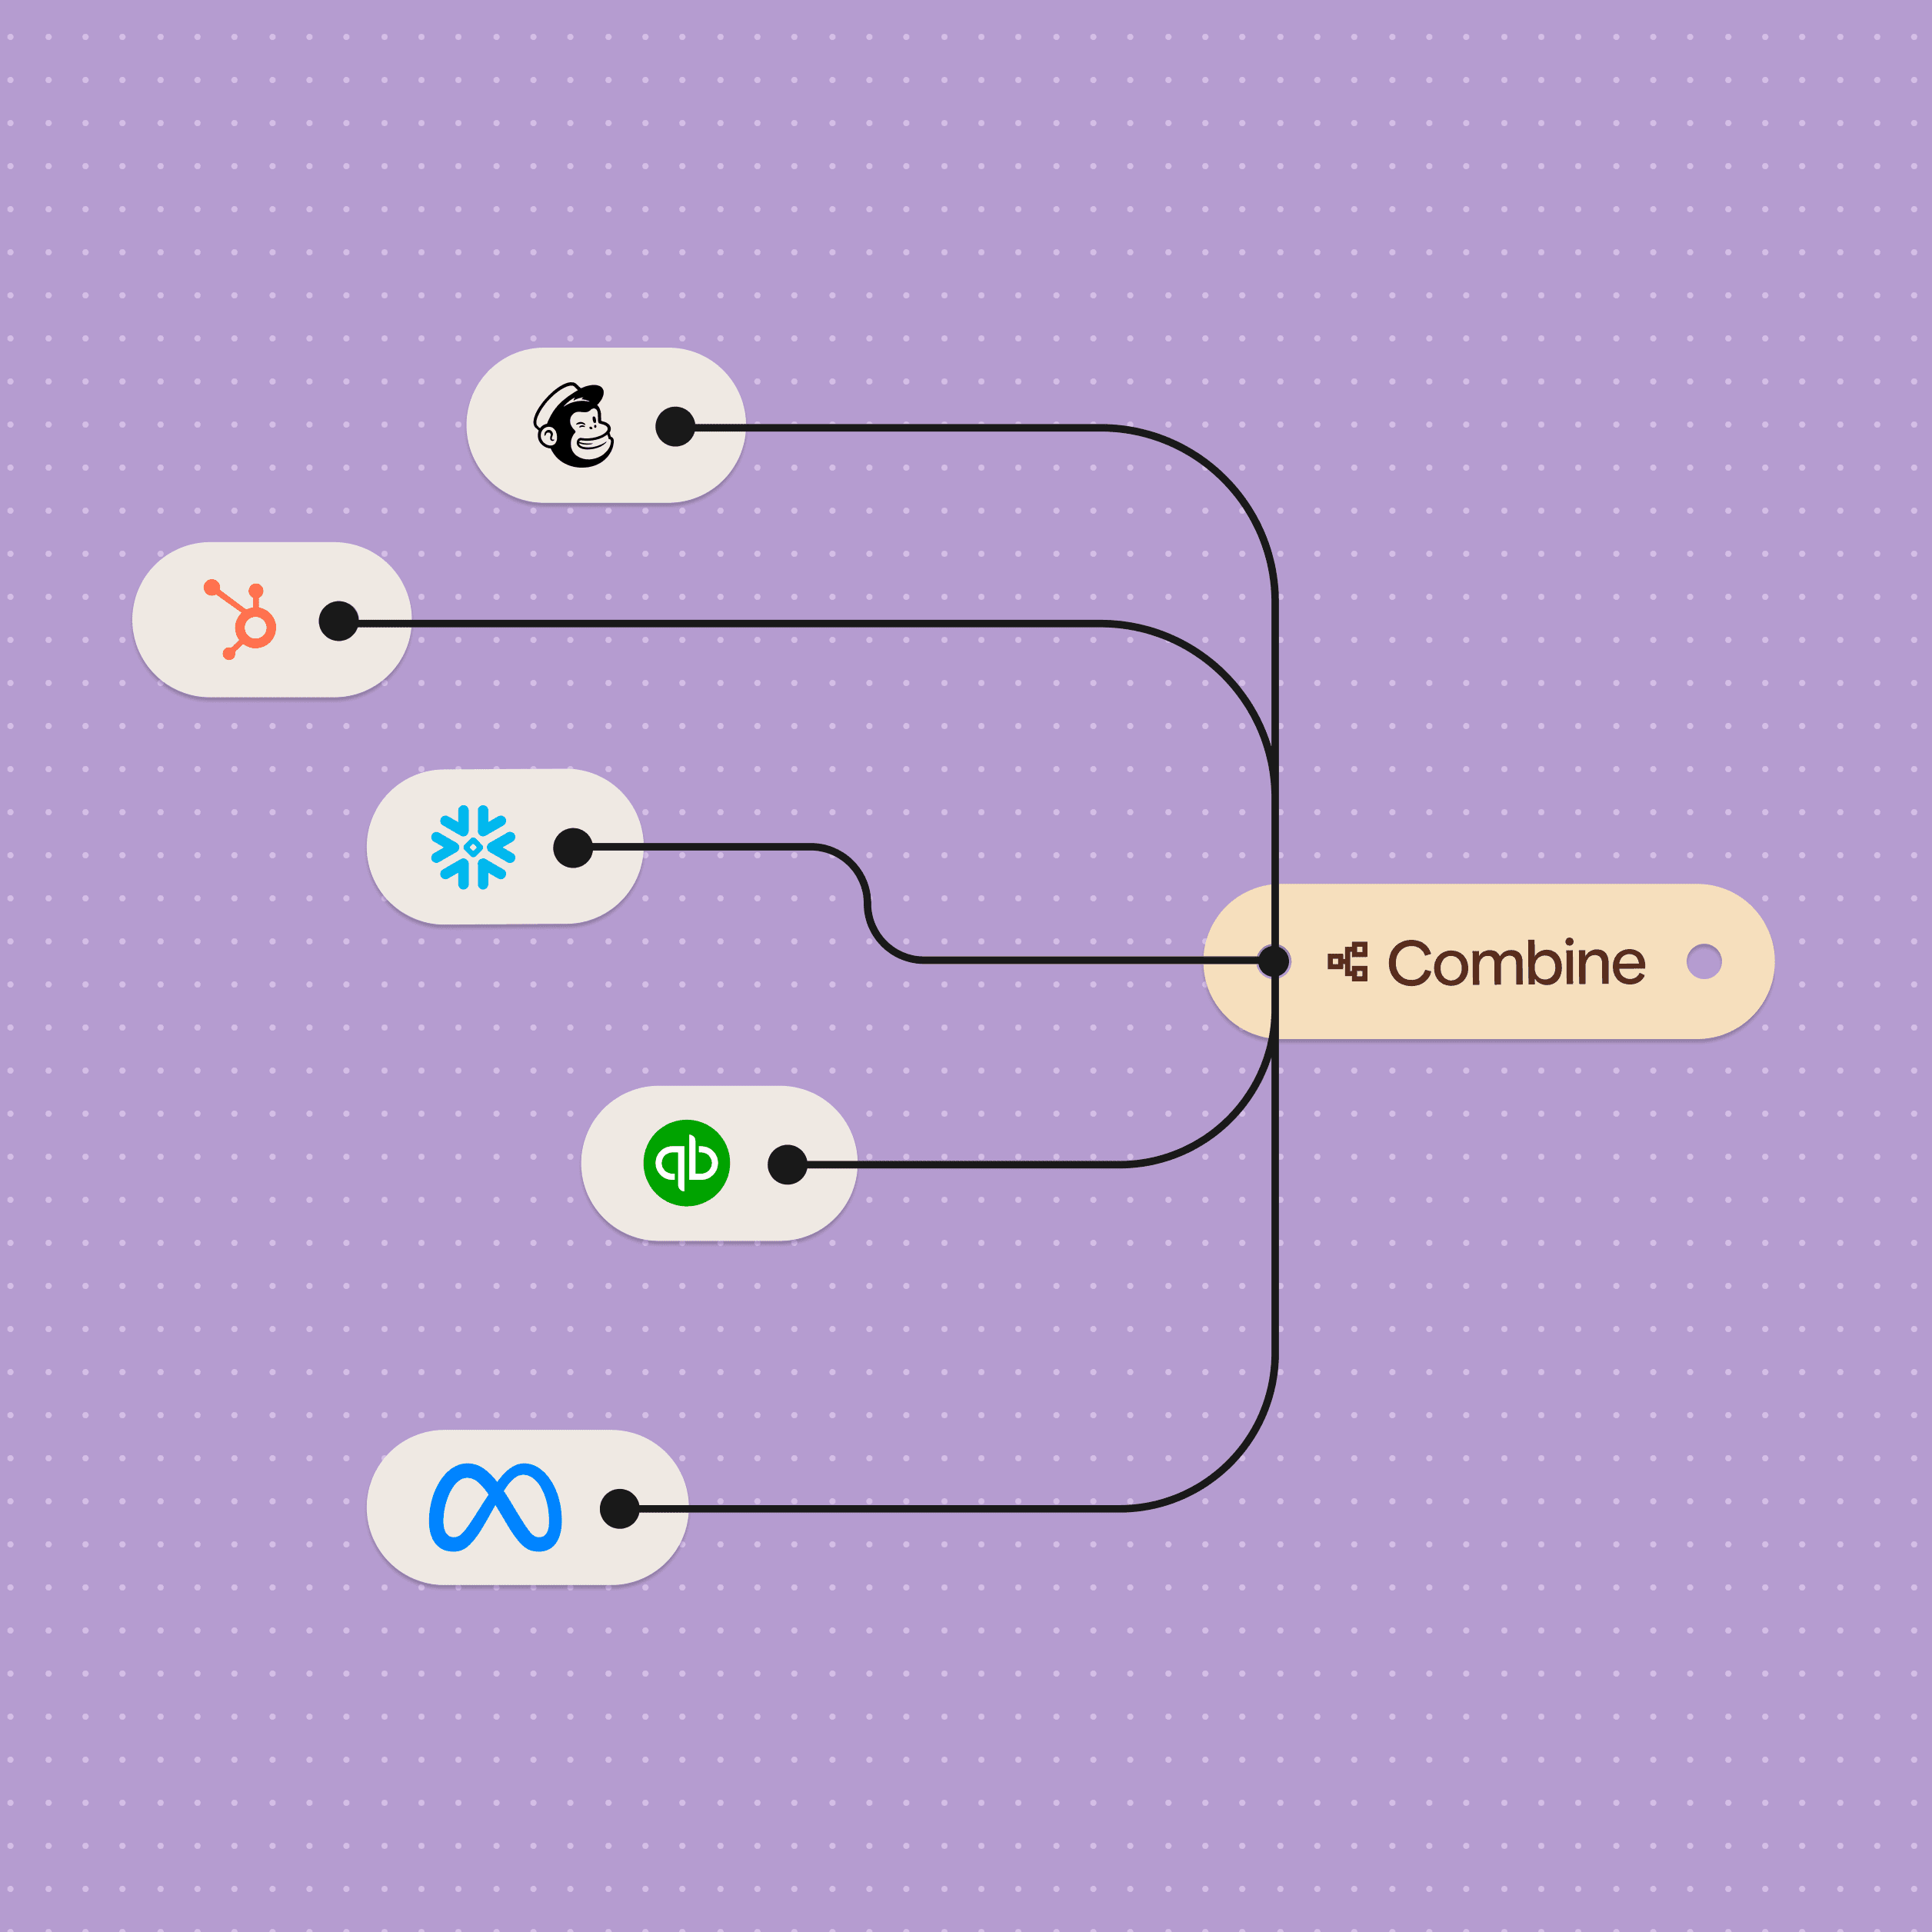
Sources extract data from your sources and load it into Less.